حتی اگر تصمیم به ثبت نام ندارید...
با پر کردن این فرم یا با تماس با 02145328 صمیمانه و با تمام وجود در کنار شما خواهیم بود.

در این مبحث به نمودار خطی نگاهی خواهیم داشت به منظور درک بهترو روش های پاسخ دهی بهتر و نشان دادن اینکه چگونه یک پاسخ را به روش های مختلف می توان سازماندهی کرد.
معمولاً روش های مختلفی برای نوشتن درباره یک نمودار رایتینگ ایلتس وجود دارد. هر کسی ممکن است به گونه ای ببیند و به طریقی متفاوت پاسخ دهد. یک روش الزاماً به روش دیگر برتری ندارد. اگر یک روش دشوار است برای پاسخ دهی بنابراین نمی تواند انتخاب صحیحی باشد.آنچه که اهمیت دارد زمانیکه شما درباره پاسخ دهی task 1 برنامه ریزی می کنید این نکته می باشد که چگونه می توانید گراف را به طریقی منطقی و شفاف سازماندهی کنید.این اغلب بدین معنی می باشد که دسته بندی داده ها به طریقی مناسب و نیز جستجو برای نمونه ها و الگوها بطور مثال جستجو برای شباهت ها و تفاوت ها می تواند روشی مناسب برای پاسخ دهی به گراف و نمودار باشد.
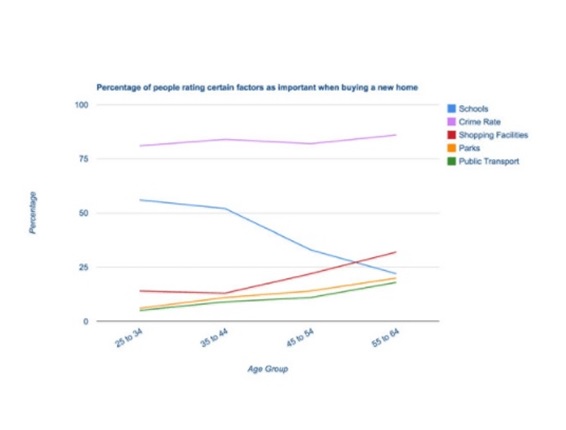
این نمونه از writing task 1 آزمونIELTS به گروه های مختلف سنی دسته بندی شده است .اگرچه یک گراف همانند مثال داده شده در یک بازه ی زمانی مشخص تعریف نشده باشد، می توان مشاهده کرد چگونه برخی تغییرات در بازه های سنی مختلف روی می دهند. در این مثال ملاحظه می کنید چگونه فاکتورهای مورد نظر در همسایگی زمانیکه یک خانه را برای سکونت برمی گزینید بر اساس سن تفاوت می کند . به سوأل و پاسخی که در ادامه مطرح می گردد توجه داشته باشید:
You should spend about 20 minutes on this task.
The line graph shows the percentage of people of different age groups and how they rate a set of factors in terms of importance when buying a new home.
Summarize the information by selecting and reporting the main features and make comparisons where relevant.
Write at least 150 words.

Model Answer 1 - Organizing by Factors
The line graph illustrates the importance, measured in percentages that four ages groups place on five different factors when they move to a new home. It is immediately apparent that a low crime rate is the most important variable across all the age groups.
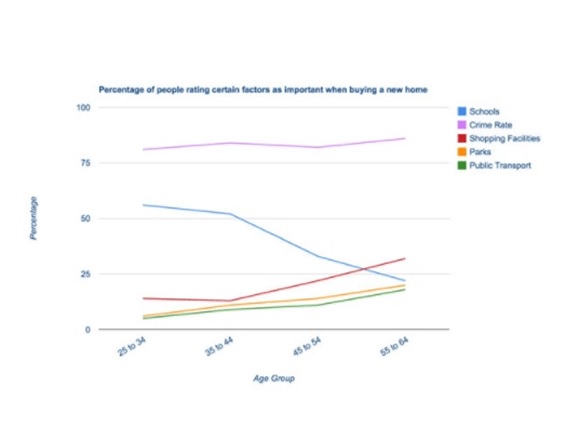
Of all the factors, the desire for a low crime rate is by far the most important. Amongst the all the age groups this figure stands at around 80%, with the middle aged and elderly viewing it as slightly more important. Next, schools are seen as very important by a significant proportion of 25 to 44 year olds although the percentages drop markedly as people get older, with just under 25% of 55 to 64 year olds viewing this as important.
Shopping facilities, being chosen by around 13%, are not viewed with such importance as schools and crime by the younger age groups. However, as people get older, this increases in importance to approximately 30%, and, as would be expected, is actually more important than schools to those over 55. Finally, although increasing in importance with age, neither parks nor public transport are viewed to be as important as the other factors by any of the groups.
Comments
همانطور که می بینید زبان آموز پاسخ خود را به این سوأل حول فاکتورها دسته بندی کرده است. هر بخشی توضیح داده شده است و همچنین با مهم ترین قسمت شروع گردیده است.کمترین مقادیر مربوط به بخش هایی است که گفتن آن ها اهمیت چندانی ندارد مانند parks و public transport. دقت داشته باشید که نمودار به تنهایی درباره هر فاکتور صحبت نمی کند بلکه مقایسه ای بین فاکتورها و گروه ها انجام می دهد . بطور مثال :
Of all the factors, the desire for a low crime rate is by far the most important.
Shopping facilities are not viewed with such importance as schools and crime by the younger age groups.
توجه داشته باشید در توصیف گراف در task 1 IELTS از توصیف یک عبارت و یک مقدار را به تنهایی بپرهیزید و همواره آن عبارات در مقایسه با سایر موارد بسنجید و مطرح کنید .

Model Answer 2 - Organizing by Age Groups
The line graph illustrates the importance, measured in percentages that four ages groups place on five different factors when they move to a new home. It is immediately apparent that a low crime rate is the most important variable across all the age groups.
The factors that are very important when purchasing a new house are very similar for the first two age groups. A low crime rate represents the greatest percentage of these groups at around 80%, though it is slightly higher for those aged 35 to 44. Schools as a factor is again very similar at around 60% for the younger age group, but dropping to around 45-50% for 35 to 44 year olds. A much lower percentage rate shopping, parks and public transport as important.
Turning to those aged over 45, low crime accounts for the largest proportion at approximately 80%, similar to those of a younger age. In contrast to the younger groups though, schooling was far less important, falling to below 25% for those aged over 55. This older group rate them as less important than shopping facilities. In fact, shopping facilities, parks and public transport all become more important factors as people get older.
Comments
این نمونه از نمودار خطی عمدتاً پیرامون گروه های سنی سازماندهی گردیده است . زبان آموز اینگونه تصمیم گرفته است که دو گروه سنی ابتدایی تقریباً مشابه هستند و می توان باهم در یک گروه جای گیرند و دو گروه سنی بعدی با یکدیگر شباهت دارند . تفاوت بین گروه سنی زیر 44 سال و نیز گروه سنی بالای 44 سال بطور مشخصی بیان گردیده است .بطور مثال :
Turning to those aged over 45, low crime accounts for the largest proportion at approximately 80%, similar to those of a younger age.
Summary
این مبحث به چگونه نوشتن درباره گروه های سنی و مثال هایی از اینکه چگونه پاسخ ها به طرق مختلفی ممکن است دسته بندی شوند، می پردازد .اگرچه این مطلب در ارتباط با نمودار خطی task 1 IELTS می باشد اما درباره هر نمودار و یا گرافی که درtask 1 مطرح شود روشی مشابه به کار برده می شود. برای اینکار می بایست ظرف مدت زمان چند دقیقه ای به دسته بندی داده ها پرداخته و برای مناسب ترین روش دسته بندی که دنبال کردن و خواندن آن هم برای ممتحن آسان باشد، تصمیم گیری کنید .
مطالب این مقاله تنها بخشی از آنچه در کلاس آیلتس زنگنه آموزش داده میشود، است. در این کلاس، نکات بیشتری برای بهبود نمره آزمون آیلتس خود خواهید آموخت.
حتی اگر تصمیم به ثبت نام ندارید...
با پر کردن این فرم یا با تماس با 02145328 صمیمانه و با تمام وجود در کنار شما خواهیم بود.